GRADE™ (Genelec Room Acoustic Data Evaluation)
is a powerful new reporting tool in GLM that creates a full analysis of room and monitoring system performance, revealing the information needed to effectively fine tune acoustic treatment, adjust monitor and listener positioning, and optimise Bass Management.
Scroll down to find a summary of GRADE's key readouts and two example reports.
GLM GRADE
GRADE™ (Genelec Room Acoustic Data Evaluation)
is a powerful new reporting tool in GLM that creates a full analysis of room and monitoring system performance, revealing the information needed to effectively fine tune acoustic treatment, adjust monitor and listener positioning, and optimise bass management.
Scroll down to find a summary of GRADE's key readouts and two example reports.
GLM GRADE
Welcome to GRADE
Before you explore GRADE’s detailed measurements and specific advice, it’s important to know that you’ll always find a brief summary of its key findings in a simple colour-coded table for quick reference and easy understanding.
Green shows excellent system performance.
Yellow shows good system performance, but some improvements may be possible.
Red shows where improvements could significantly enhance your system.
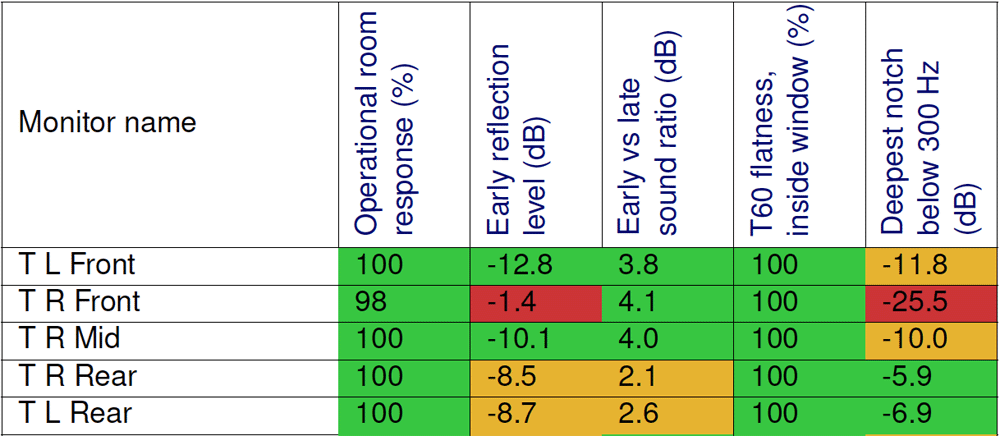
A small section of GRADE’s Summary table. See the full table in Example Report 2: Immersive Monitoring.
Note: Creating GRADE reports requires you to have access to a set of Genelec Smart Active Monitors, GLM 5 software, a GLM Calibration Kit or 9320A SAM Reference Controller, and your free MyGenelec credentials.
Frequency domain analysis
Frequency response graphs
GLM users will be familiar with this graph. It's the same one that appears after calibration to show the measured frequency response of your system (red line), GLM's corrective filtering (blue line), and the resulting response after correction (green line). GLM aims to achieve a flat response, giving you the best possible foundation to work from.
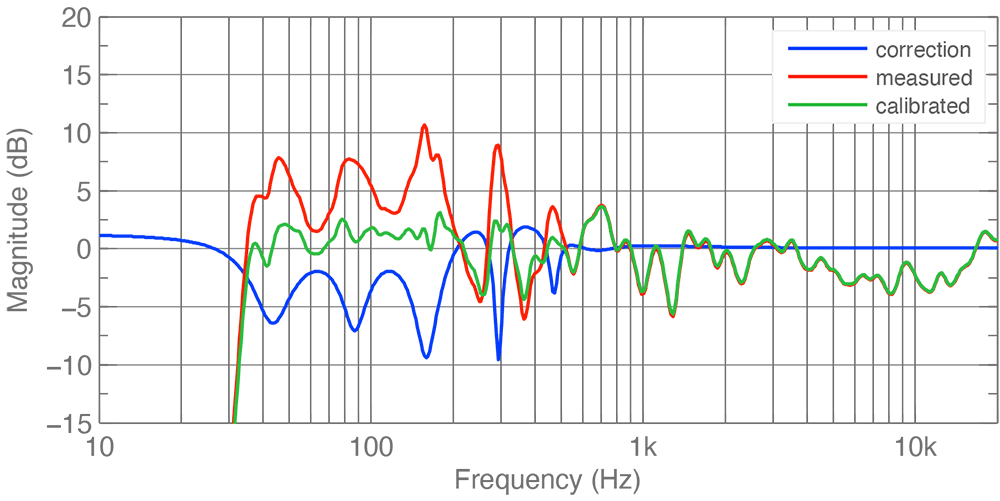 No dips below 200 Hz.
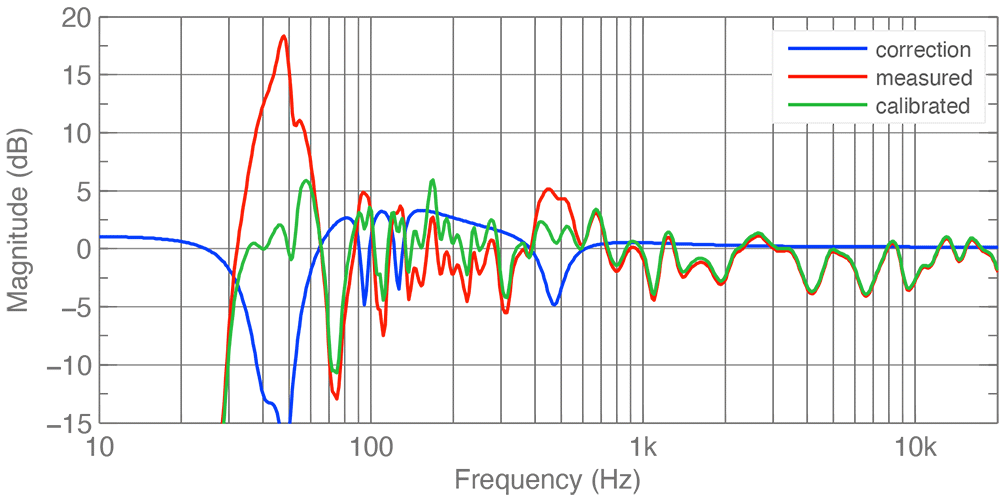 A significant dip at 75 Hz, perhaps caused by a reflection from the back wall at a distance of approx. 1.14 m (quarter-wavelength-rule). A position closer to the wall could improve the response.
Low frequency extension
All Genelec monitors provide exceptional bass extension relative to their size, yet each monitor's low-frequency response is in some way affected by positioning and overall room acoustics. GRADE identifies the position on the spectrum at which low frequencies drop to half the average sound pressure measured in the system’s midrange. The location of this level reduction is called the -6 dB point, and knowing it allows you to compare the performance of the monitors and subwoofers in your room with references from our anechoic chamber. In turn, this helps you to tweak their positioning for optimal bass extension. Monitors can be placed for instance, closer to walls or corners to lower the system's – 6 dB point by summing up the low frequencies.
Similarly, GRADE measures a – 6 dB cutoff point for the high-frequency response of subwoofers.
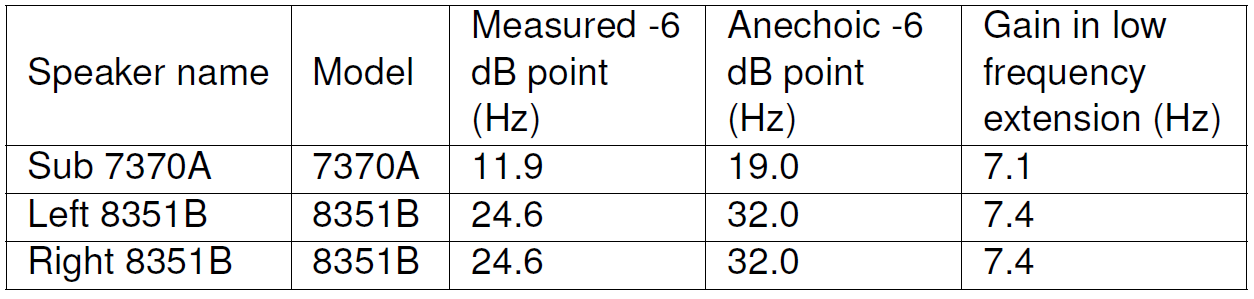 This system’s low frequency response is extended due to its close proximity to a wall.
Peaks and notches
GRADE creates a peaks and notches graph to highlight the room influences that affect each individual monitor’s frequency response. This is measured before calibration and is subject to many factors such as room size, acoustic treatment and positioning relative to hard surfaces. This readout gives you a clear picture of how monitor placement can be optimised through re-positioning, room improvements or negative equalisation.
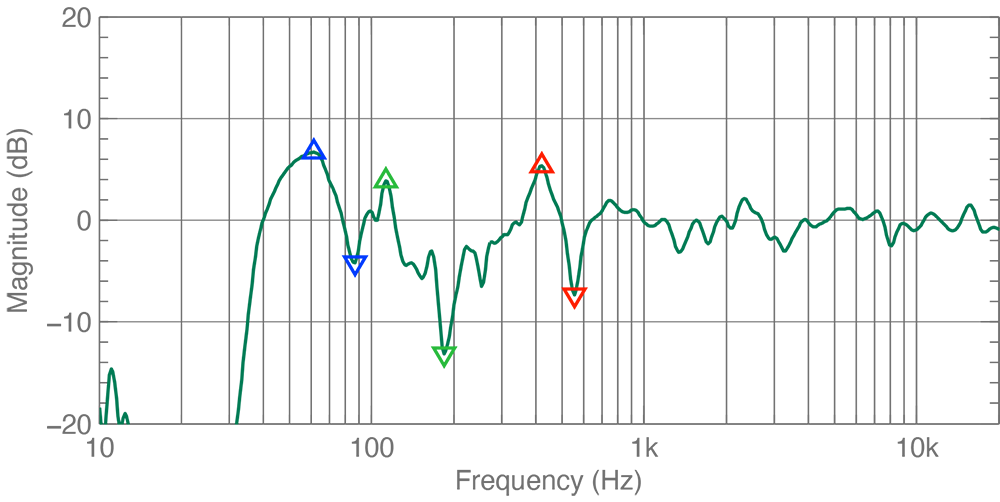 The marked notches are of particular interest. They may be caused by hard-surface reflections at a certain distance, leading to frequency cancellation. Placement should be optimised to avoid these negative effects.
Time Domain Analysis
Time of flight
As with stereo setups, multichannel setups produce the best imaging when there's an equal distance between each monitor and the listening position. If ideal placement isn’t possible, GLM can adjust the time of flight using a delay and corrective gain to emulate the same effect. As with other measurements, GRADE's intuitive visual representation makes interpreting the results much more straightforward.
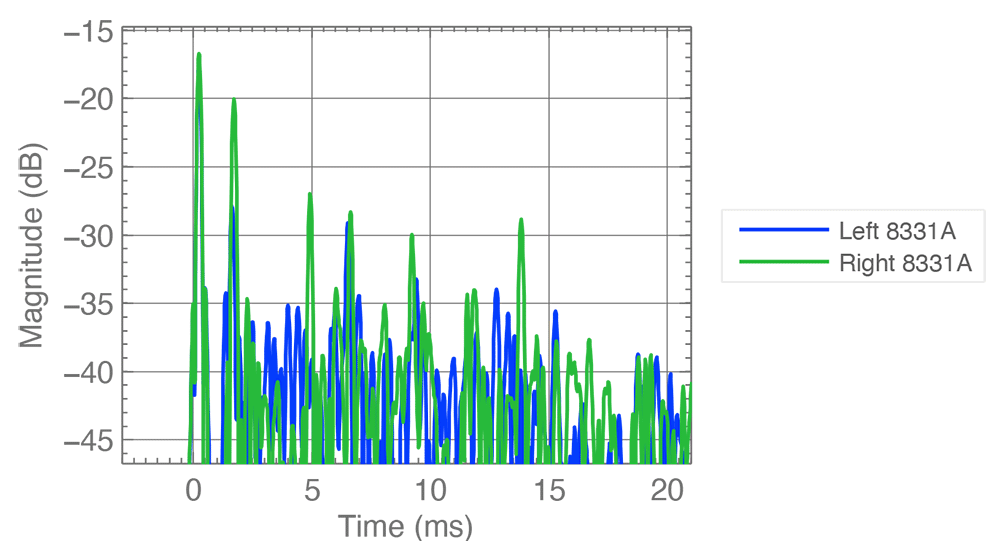 The time of flight for a stereo pair. Sound images will appear in the correct locations when the measured times are almost identical.
All early reflections
Early reflections are caused by system sound bouncing off nearby surfaces such as furniture or walls. These reflections can sum up with the direct sound, causing undesired sound colouration and stereo imaging problems for the listener. GRADE reveals every early reflection in your room and compares each one with the direct sound level. Armed with this information you can go on to identify solutions for reducing or avoiding this negative effect.
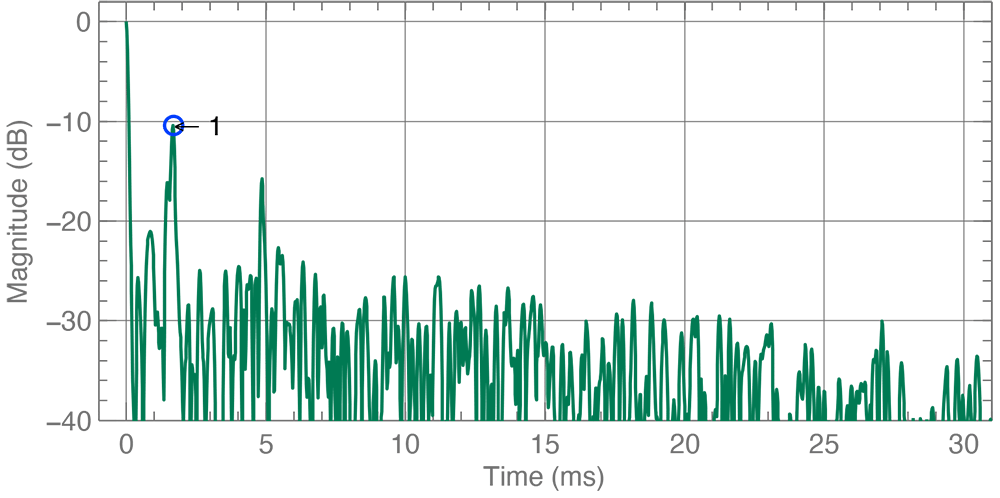 Well controlled early reflections due to the use of absorbers. There’s only one higher-level reflection.
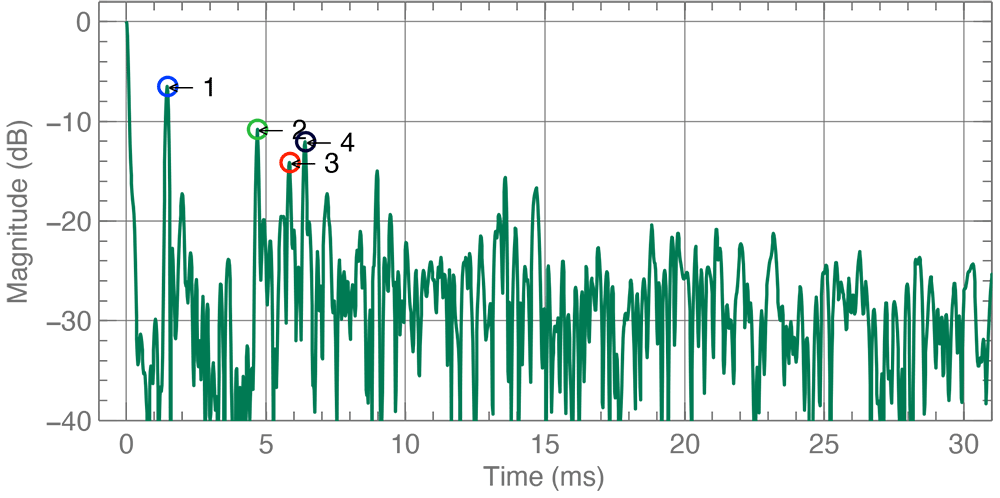 Many more early reflections, marked 1-4. Absorbers might reduce these.
Early vs late sound
Whether you're mixing audio or simply listening to it, it's always best to hear the direct sound from your monitors rather than the room sound. GRADE compares every sound arriving at the listening position within 20 milliseconds to the late reflections that arrive afterwards. This allows you to determine whether you have enough direct sound at your listening position, and may help inform any further use of acoustic treatment.
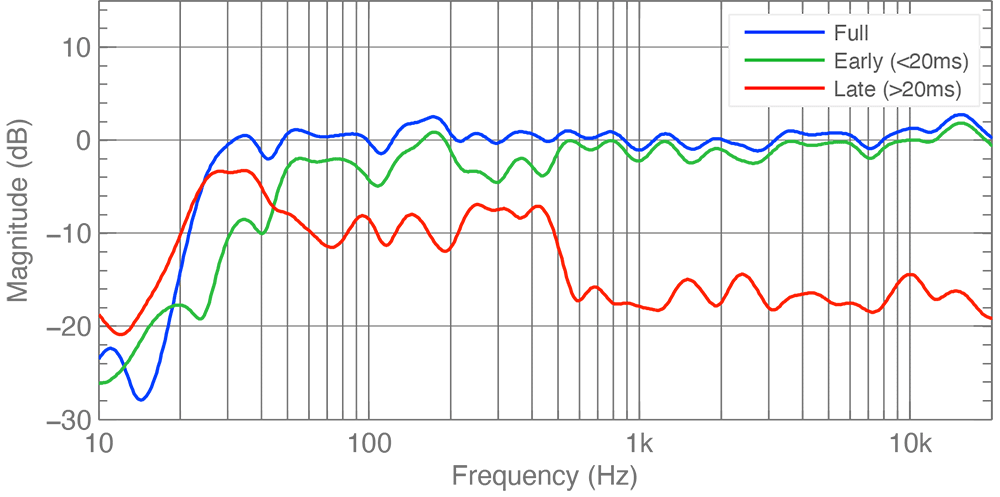 Absorbers in this room are very effective above 400 Hz. In the range they’re affecting, the direct sound to room sound ratio will be very healthy.
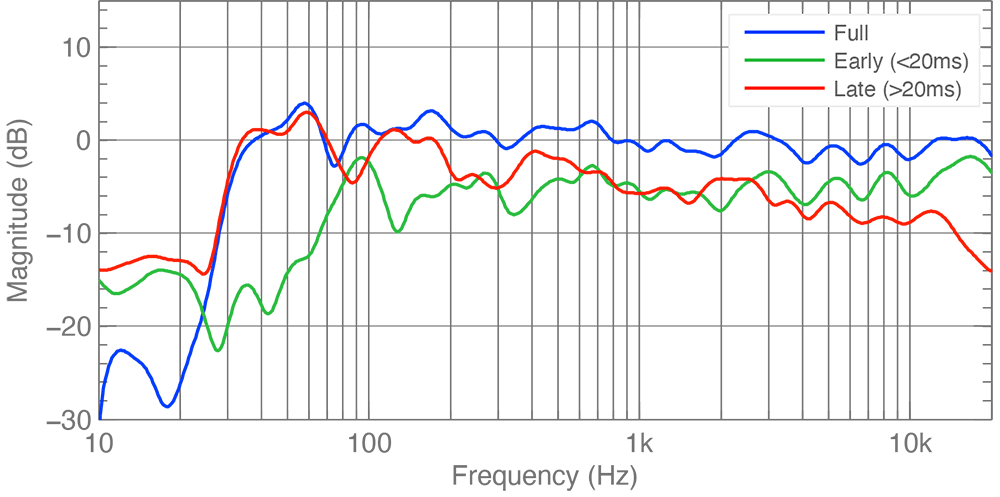 An untreated living room with a larger listening distance. The direct sound level is almost the same as the late room sound. It may help to add treatment or move the listening position closer to the system.
Time-Frequency Domain Analysis
Reverberation time
GRADE's reverberation time (RT60) chart shows the decay time (T60) of nine key frequency ranges at one-octave intervals. Your room’s RT60 is the mean average of the T60 decay times recorded for each individual band. When a room’s T60 values are similar across all frequencies, audio will sound detailed and balanced. Optimal results are especially critical for a system’s midrange frequencies.
 Treatment for lower frequencies such as bass traps, could help to reduce low-frequency reverberation time.
Waterfall
GRADE's Waterfall analysis allows you to spot issues in the decay time of different frequencies, which is helpful in evaluating the effects of acoustic treatment. The measurements reveal the presence of lengthy decays, known as ringing, which can negatively affect your listening and recording experience through masking and intrusive room sound. In general, low frequencies and room modes ring for longer than mid and high frequencies.
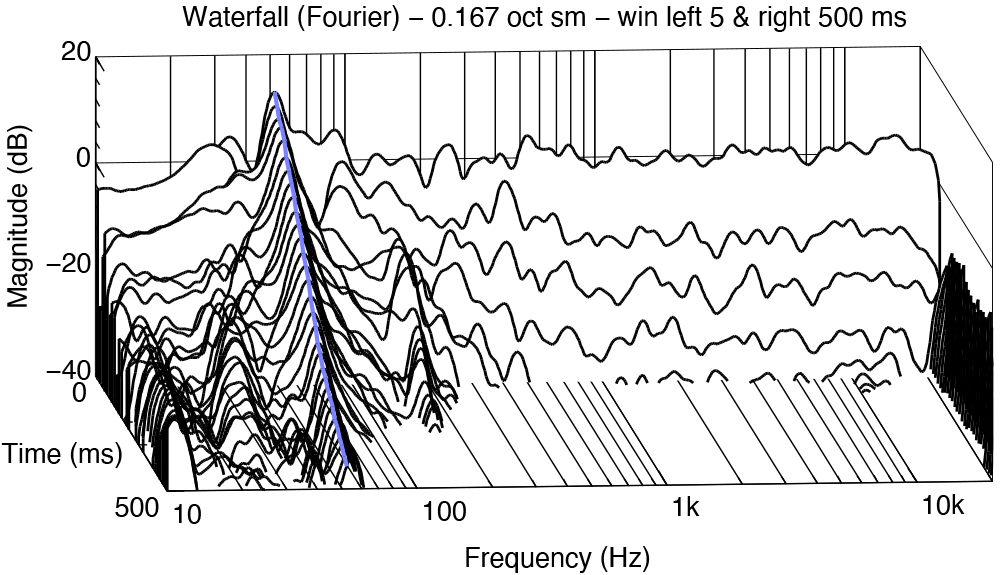 Decay times are well controlled above 100 Hz. Additional treatment such as bass traps could help to further reduce the low-frequency decay times.
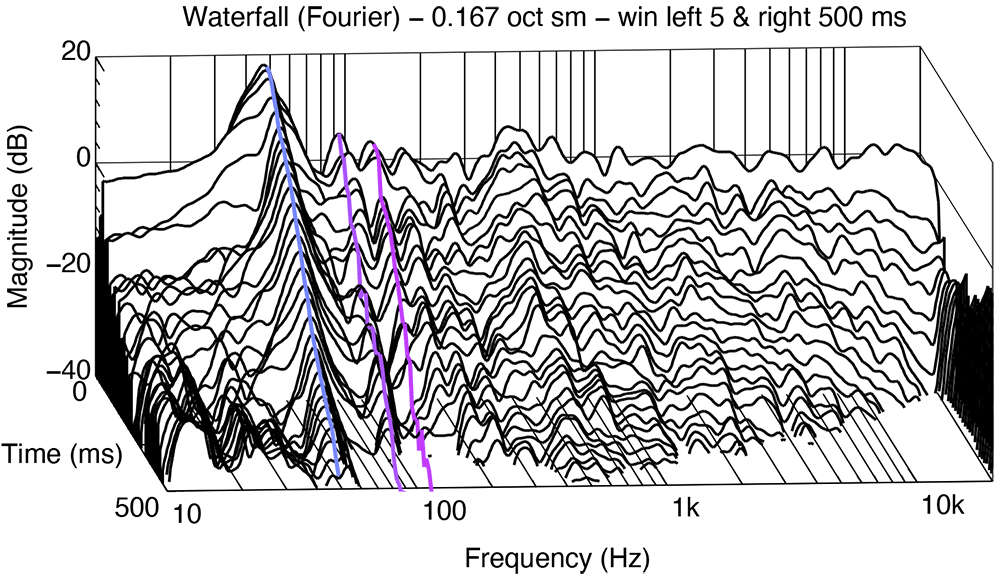 Long decay times in an untreated living room. It may help to add acoustic treatment or move the listening position closer to the system.
Wavelet
GRADE's Wavelet analysis shows time and frequency in much more detail than the Waterfall analysis. This extra resolution enables a greater understanding of the reflections in your room, complementing Waterfall's focus on resonance. The Wavelet diagram helps you to evaluate both your acoustic treatment and the positioning of your system.
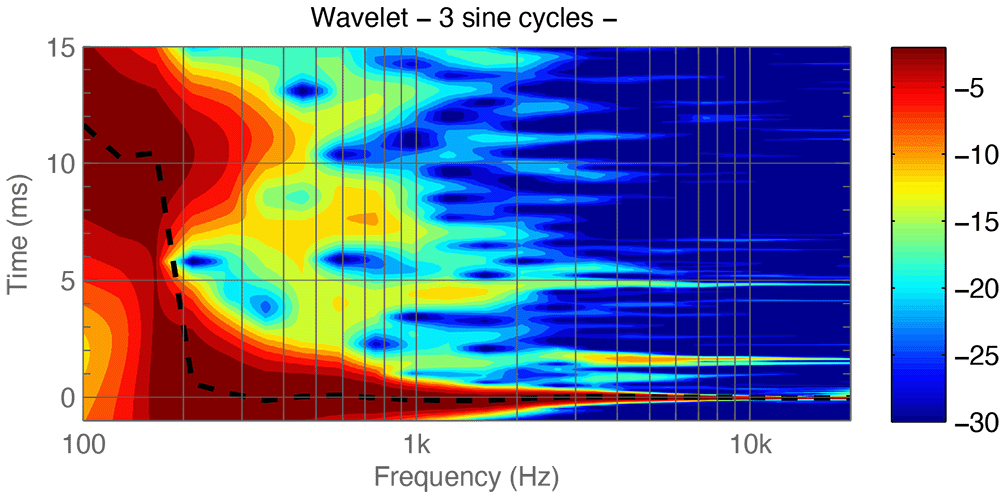 Early reflections are well controlled due to treatment. There are very few red, orange or yellow spikes, especially in the higher frequencies, the blue colour indicating low-level reflections.
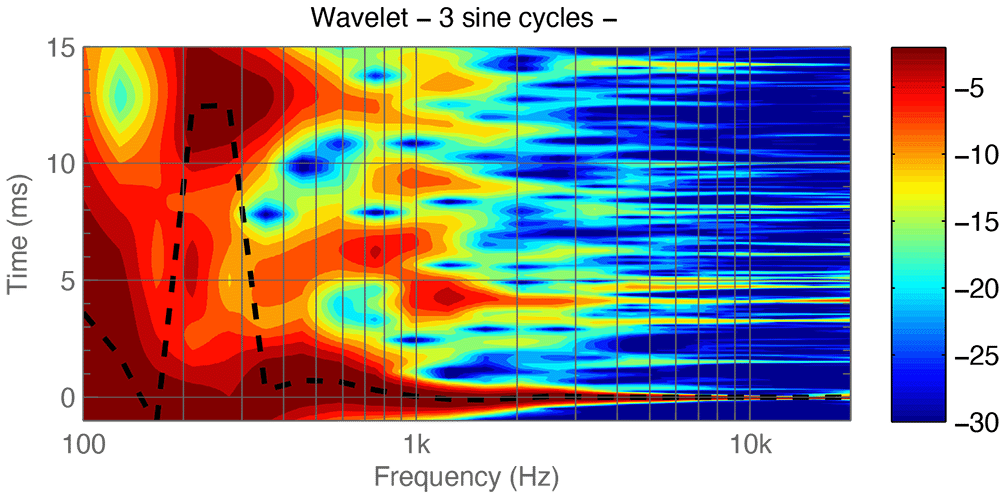 Lots of early reflections measured inside an untreated room (shown as red, orange and yellow spikes).
ITU-R BS1116 Compliance
Operational room response curve check
ITU-R BS.1116 is the standard framework used by broadcasters to assess the quality of listening spaces. A space that complies with the recommendations is deemed to be highly suitable for professional audio work. Using GRADE, it's simple to determine whether your room meets the recommendations.
The frequency response at the listening position is called the operational room response. Ideally, GRADE will show a very similar level across all frequencies, indicating a neutral, uncoloured listening experience that complies with ITU-R recommendations. The green lines in the diagram show how far the results can safely deviate from a perfectly flat response without significant colouration or failure to comply with the recommendations.
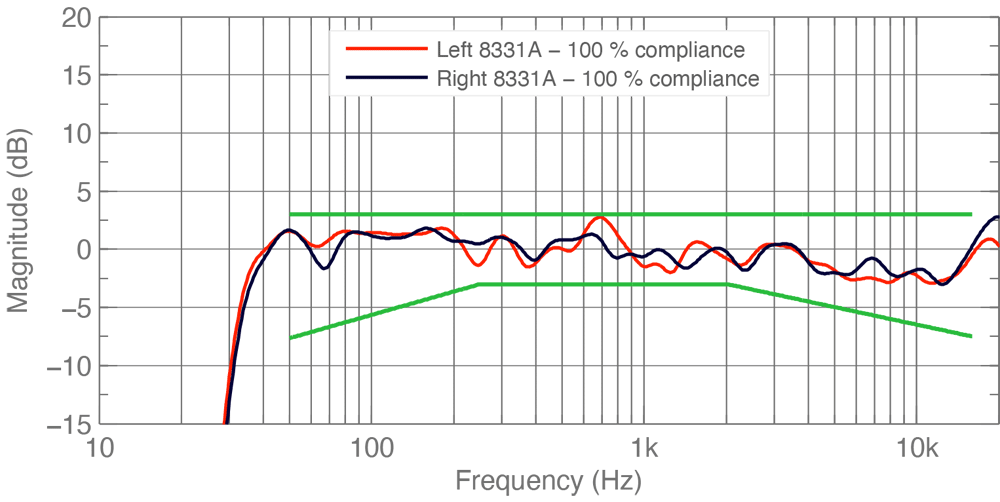 After calibration this system shows 100% compliance for both monitors.
Early reflections check
Using the early reflections measurements detailed in the Time Domain Analysis section detailed above, GRADE allows you to check if your room meets the ITU-R recommendation that early reflections are – 10 dB relative to the direct sound from the monitors.
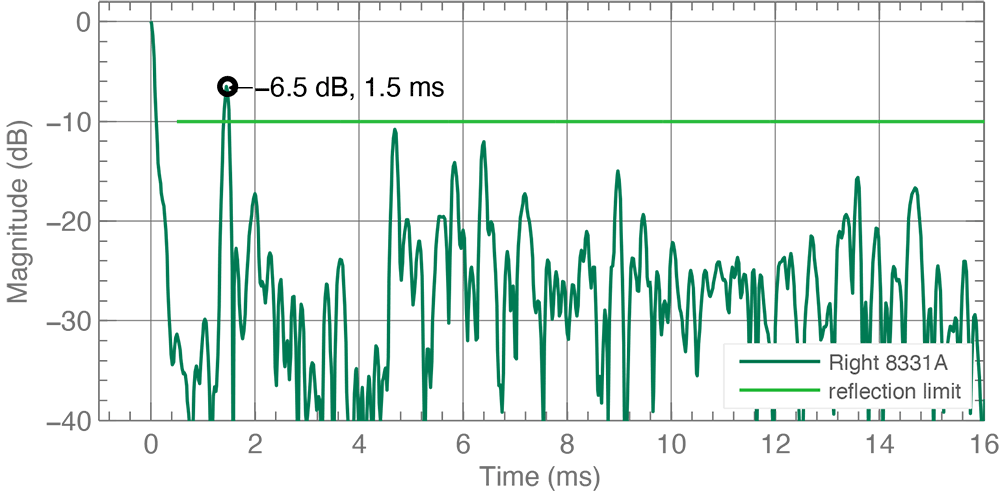 One early reflection is above the -10 dB limit.
Reverberation time check
GRADE checks your room’s reverberation-time performance against ITU-R’s guidelines. Their recommendation for reverberation time depends on each room's acoustic volume, so it's necessary to find that out first. This is done by measuring the room’s dimensions up to its hard walls. This means the acoustic volume may be larger than the visible volume, as soft, absorbent materials are not counted.
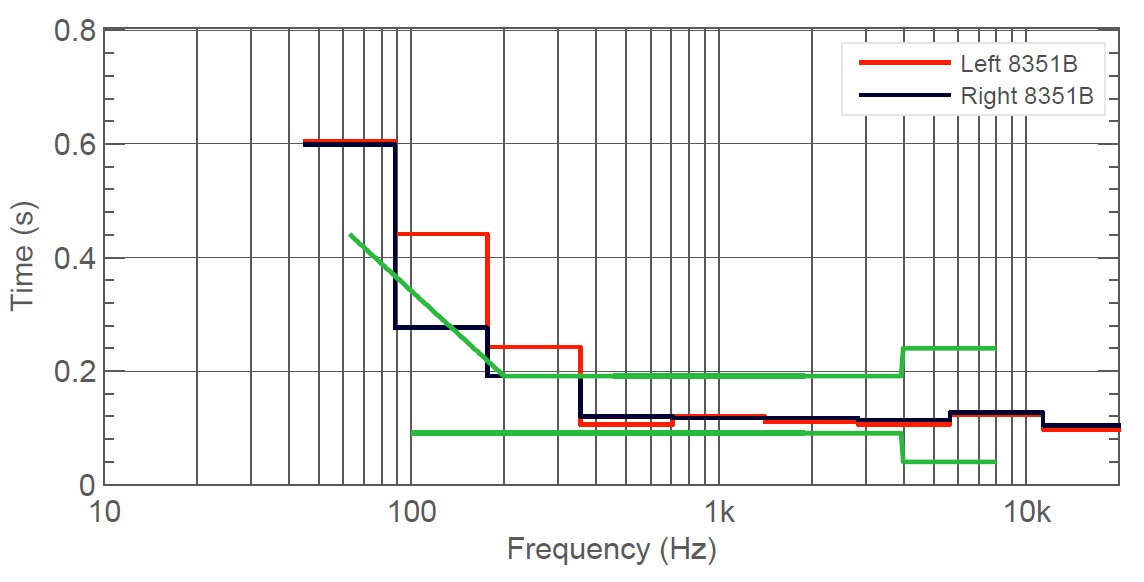 The reverberation time is too long below 300 Hz. Bass traps may help to optimise the bass range.
Sample Reports
Example 1: Nearfield Monitoring
2.1 nearfield monitoring, listening distance 1.1 metres and room volume 18 m3.
Download Report ›Example 2: Immersive Monitoring
Immersive monitoring, room volume 254 m3.
Download Report ›Pricing
GRADE Report packages
Choose from a pack of six or twelve GRADE Room Acoustic Reports, which you can generate whenever you choose – with no time limitation.
Please note that a one-time free gift of 12 GRADE Reports is given to everyone who registers an account on MyGenelec.
30 € (6 GRADE reports)
50 € (12 GRADE reports)
GRADE Reports – annual subscription
Enjoy GRADE and generate unlimited GRADE Room Acoustic Reports for a full year.
For educational and enterprise subscriptions, please contact us.